
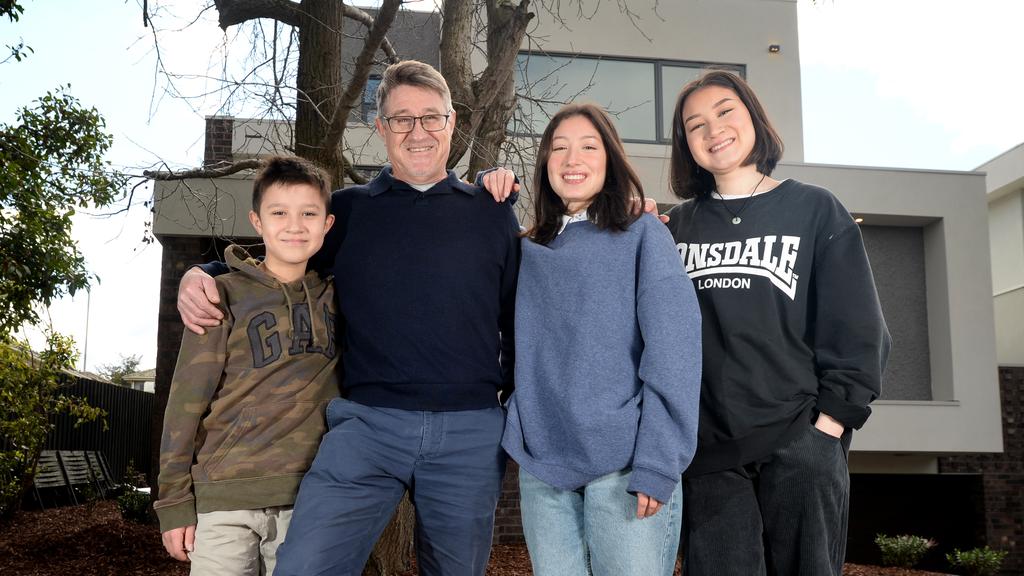
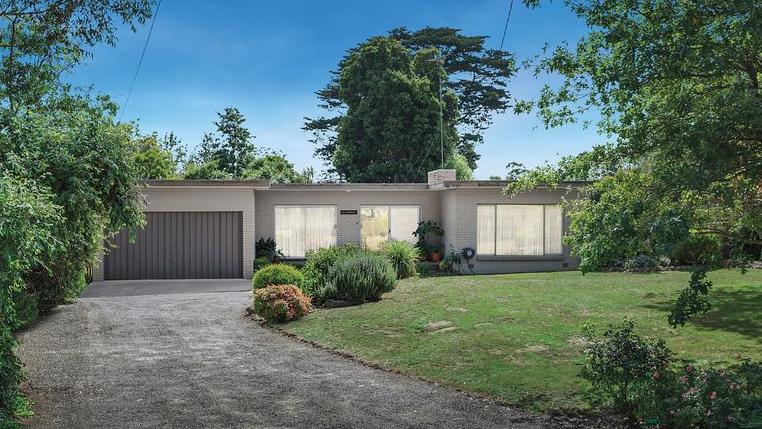
Allan Morriss with his kids Oscar, 13, Isabella, 16, and Lauren, 19, outside the redeveloped property at 9 Pavo St, Balwyn North, they are preparing for sale once stage four restrictions ease. Picture: Andrew Henshaw
Budding buyers and vendors are “chomping at the bit” to push ahead with their property plans now spring — traditionally the year’s busiest selling season — is here.
But the Melbourne market won’t be able to bloom until the city’s stage four coronavirus restrictions are eased.
Real Estate Institute of Victoria president Leah Calnan said a key factor would be the return of physical inspections, which had been outlawed in Melbourne since early August in a move that had crippled listing and sales activity.
RELATED: REIV slams leaked road map out of Melbourne lockdown
How to get ready to buy when the property market returns this spring
Melbourne homes lose $30k amid stage four market ‘freeze up’
SEE EVERY SUBURB’S MEDIAN HOUSE AND UNIT PRICE BELOW
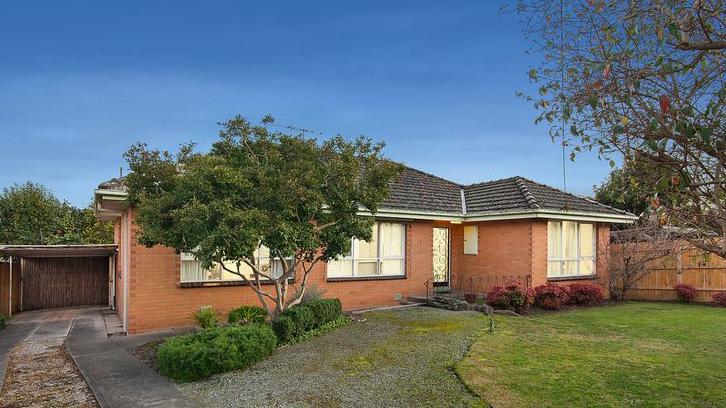
1 Douglas Avenue recently sold for $1.052m in Box Hill South, a top performer for annual price growth.
Just 21 homes are scheduled to go under the hammer this weekend in the city, which normally prides itself on being Australia’s auction capital. This is the lowest volume ever recorded by the REIV, barring public holiday weekends.
“This reflects how the market has had to adjust and deal with the stage four restrictions,” Ms Calnan said.
“But we know there’s a lot of activity happening behind the scenes to prepare for sales in the coming months.
“Spring campaigns will start a few weeks later than what we’ve seen in the past, (then) we’ll probably see auction activity … through to Christmas.”
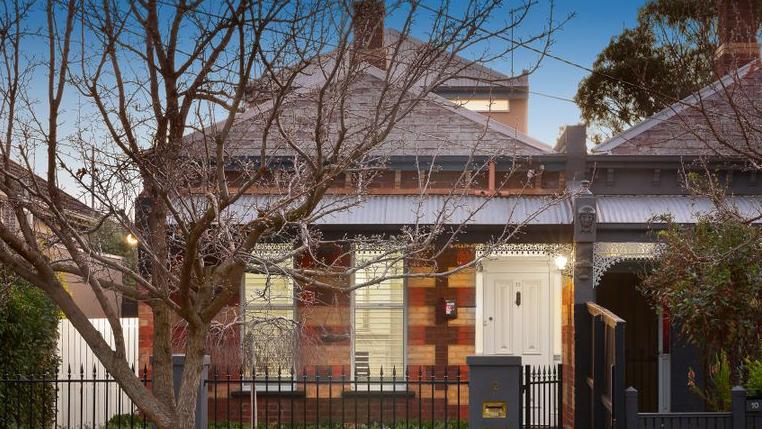
12 Albert Street, Caulfield North sold for $1.91m.
While weekly auction volumes regularly topped the 1000 mark in spring, they were highly unlikely to reach those heights while auctions were restricted to online platforms, she added.
The latest REIV data shows many Melbourne suburbs have sustained impressive annual price growth despite the turbulent COVID-19 period.
Box Hill South, Caulfield North and Hughesdale were top performers, with their median house prices rising more than 25 per cent in the year to June 30. West Melbourne and Fairfield’s unit medians gained more than 30 per cent.
Houses and units in blue-chip eastern suburbs Balwyn North, Balwyn, Mont Albert North and Box Hill also flourished in the past year.
Belle Property Balwyn agent Claire Wenn expected the pocket to keep holding its value, with plenty of buyers poised to pounce. “School zones have a lot to do with the strength of these suburbs, with Balwyn High, Kew High and Kooyong Secondary College all in the area,” she said.
1/33 Grice Crescent, Essendon sold sight-unseen for $670,000 during the stage four lockdown.
Ms Wenn said agents had been making the most of the stage four lockdown by contacting potential buyers on their database, preparing listings and booking photographers for future campaigns.
Property developer Allan Morriss is preparing to list a luxury home at 9 Pavo Street in Balwyn North this spring.
“I’ve built a few other large homes in Balwyn North and the suburb has always done well,” he said. “It hasn’t really gone down in price a great deal over the years, regardless of what else is going on.”
Mr Morriss said his family had also called the suburb home since 2008, with his five children attending the prized Balwyn High. “The proximity to shops, schools and amenities has always been a great advantage to the area,” he said.
37 Main Road, Lower Plenty notched a $915,000 sale.
On the flip side, the REIV found the median house prices in Lower Plenty, St Kilda and Carrum had shed up to 15.3 per cent in the past year. Caulfield North, Black Rock and Werribee units also experienced some of the city’s largest losses.
Wakelin Property Advisory director Jarrod McCabe said the pandemic had weakened suburbs that typically relied on one buyer profile, like family-centric Lower Plenty. But this shouldn’t deter buyers who spotted their dream home in a falling market.
“You should be buying property for the long term,” he said. “I’d see that as an opportunity.”
Mr McCabe advised “discretionary vendors” who didn’t need to sell to hold off until in-person inspections, and ideally auctions, were allowed again.
This one-bedroom unit at 2/18 Mascoma Street, Ascot Vale recently fetched $360,000.
Advantage Property Consulting director Frank Valentic tipped “a flurry of activity” to help boost prices in struggling areas once physical inspections and on-site auctions returned.
“It could be likened to the pent-up demand we see in February every year, after the market has been shut down since December,” he said.
The vendor advocate said he had 15 clients ready to hit the spring market once restrictions eased.
But he forecast a shortage of stock compared to most spring seasons, with any more than 250 online auctions per week unlikely until street sales could return to Melbourne.
He said a scarcity of available housing stock was helping insulate prices from big drops.
“There are still more buyers than there are properties for sale, which is why you often see five or six families fighting for a home at auction,” he said.
-with Samantha Landy
MORE: Victoria freeze on evictions, rental support package could stretch into 2021
Century-old South Melbourne pub sells amid trying time for hospitality
Ex-AFL player’s California-inspired holiday home ‘Dollywood’ for sale
Median price, and annual increase or decrease, for every Melbourne suburb
Houses
ABERFELDIE: $1,382,500 / 8.7%
AIRPORT WEST: $809,500 / 3.5%
ALBERT PARK: $1,806,250 / 11.2%
ALTONA NORTH: $785,000 / 1.9%
ARMADALE: $2,275,900 / 22.5%
ASCOT VALE: $1,256,000 / 2.7%
ASHBURTON: $1,550,000 / 2.9%
ASPENDALE: $999,000 / -2.8%
AVONDALE HEIGHTS: $791,000 / -0.3%
BALWYN: $2,206,000 / 0.6%
BALWYN NORTH: $1,772,500 / 15.4%
BAYSWATER: $755,000 / 4.5%
BAYSWATER NORTH: $697,500 / 5.4%
BEACONSFIELD: $820,000 / 3.9%
BEAUMARIS: $1,750,000 / 12.1%
BELGRAVE: $680,000 / 3.8%
BENTLEIGH: $1,494,000 / 4.1%
BENTLEIGH EAST: $1,150,000 / 12.1%
BERWICK: $729,000 / 4.4%
BLACK ROCK: $1,600,000 / 2.9%
BLACKBURN: $1,450,000 / 12%
BLACKBURN NORTH: $1,043,000 / 8%
BLACKBURN SOUTH: $1,105,000 / 14.8%
BLIND BIGHT: $650,000 / 0.6%
BONBEACH: $855,222 / 6.6%
BORONIA: $693,756 / 9.5%
BOTANIC RIDGE: $753,750 / -1.5%
BOX HILL NORTH: $1,261,888 / 13.2%
BOX HILL SOUTH: $1,239,000 / 39.7%
BRAYBROOK: $652,000 / -8.7%
BRIGHTON: $2,500,000 / 13.1%
BRIGHTON EAST: $1,835,000 / 5.3%
BROOKFIELD: $493,750 / -1.4%
BRUNSWICK: $1,100,000 / 15.4%
BRUNSWICK EAST: $1,472,500 / 8.4%
BRUNSWICK WEST: $1,162,500 / 2.2%
BULLEEN: $1,164,250 / 12.6%
BUNDOORA: $698,000 / 8.9%
BURWOOD: $1,100,000 / 6.8%
BURWOOD EAST: $995,900 / 10.3%
CAMBERWELL: $2,300,000 / 12.5%
CANTERBURY: $2,675,000 / 10.5%
CARLTON NORTH: $1,590,000 / 6.3%
CARNEGIE: $1,225,000 / 14%
CAROLINE SPRINGS: $542,500 / 2.6%
CARRUM: $791,495 / -10.8%
CARRUM DOWNS: $572,000 / no change
CAULFIELD NORTH: $1,821,500 / 26.9%
CAULFIELD SOUTH: $1,513,125 / 4.7%
CHADSTONE: $980,000 / 18.8%
CHELSEA: $1,007,500 / -7.3%
CHELTENHAM: $915,000 / 11.2%
CHIRNSIDE PARK: $787,650 / 6.8%
CLAYTON: $1,051,500 / 2.8%
CLIFTON HILL: $1,200,000 / 4.1%
CLYDE: $576,500 / 1.5%
CLYDE NORTH: $575,000 / 4.3%
COBURG: $970,000 / 14.2%
COBURG NORTH: $879,000 / 15.2%
COCKATOO: $600,000 / 15.4%
COLLINGWOOD: $1,150,000 / 11.6%
CRAIGIEBURN: $553,000 / 1.8%
CRANBOURNE: $520,000 / 2%
CRANBOURNE EAST: $575,000 / 1.2%
CRANBOURNE NORTH: $587,000 / -0.9%
CRANBOURNE WEST: $501,000 / no change
CROYDON: $750,000 / 3.6%
CROYDON HILLS: $922,500 / 3.2%
CROYDON NORTH: $995,000 / 4%
CROYDON SOUTH: $800,000 / 2.7%
DANDENONG: $645,000 / 5.7%
DEER PARK: $552,500 / 4%
DELAHEY: $546,500 / 1.4%
DIAMOND CREEK: $751,500 / 1.3%
DONCASTER: $1,230,000 / 9.1%
DONCASTER EAST: $1,225,000 / 6.1%
DONVALE: $1,244,000 / 2.3%
DOREEN: $600,000 / 3.3%
EAGLEMONT: $2,029,000 / -6.4%
EDITHVALE: $980,000 / 10.5%
ELSTERNWICK: $1,651,000 / 7.8%
ELTHAM: $1,022,000 / 8.8%
ELTHAM NORTH: $966,000 / 6.6%
ELWOOD: $2,300,000 / 8.5%
EMERALD: $710,000 / 2.2%
ENDEAVOUR HILLS: $615,000 / 2.9%
EPPING: $600,000 / 2.6%
ESSENDON: $1,455,000 / 1.5%
FAIRFIELD: $1,300,000 / -1.5%
FAWKNER: $720,000 / 3.4%
FERNTREE GULLY: $734,625 / 8.2%
FITZROY: $1,550,000 / 8.5%
FITZROY NORTH: $1,675,000 / 7.4%
FLEMINGTON: $1,010,000 / 9.6%
FOOTSCRAY: $900,000 / -3.7%
FOREST HILL: $1,006,000 / 12.6%
FRANKSTON: $597,500 / 5.1%
FRANKSTON NORTH: $440,000 / -2.3%
FRANKSTON SOUTH: $868,000 / 5.3%
GLADSTONE PARK: $600,000 / 4.8%
GLEN IRIS: $1,875,000 / 13.9%
GLEN WAVERLEY: $1,218,500 / 7.1%
GLENROY: $720,000 / 6.7%
GREENSBOROUGH: $857,000 / 7.5%
GREENVALE: $728,250 / -3.3%
HAMPTON: $2,520,000 / -1.3%
HAMPTON EAST: $1,350,000 / 15.7%
HAMPTON PARK: $496,500 / -1%
HARKNESS: $520,000 / 6.7%
HAWTHORN: $2,007,500 / 8.2%
HAWTHORN EAST: $2,295,000 / 15.6%
HEALESVILLE: $610,000 / -2.4%
HEATHERTON: $1,002,500 / 6.1%
HEATHMONT: $981,250 / 1.4%
HEIDELBERG HEIGHTS: $772,325 / 3.6%
HEIDELBERG WEST: $492,500 / -5.7%
HIGHETT: $1,262,000 / 15%
HILLSIDE: $680,000 / -1.1%
HOPPERS CROSSING: $527,500 / 0.7%
HUGHESDALE: $1,505,000 / 25.3%
IVANHOE: $1,210,000 / 6.2%
IVANHOE EAST: $1,800,000 / 15.2%
KALKALLO: $585,000 / 4.2%
KEILOR: $950,000 / 17.1%
KEILOR DOWNS: $680,575 / 0.3%
KEILOR EAST: $850,000 / 9%
KENSINGTON: $990,000 / 11.9%
KEW: $2,180,000 / 12.2%
KEW EAST: $1,732,500 / 4.1%
KEYSBOROUGH: $749,950 / 0.3%
KILSYTH: $672,500 / 6.3%
KINGS PARK: $534,000 / -2.4%
KOO WEE RUP: $471,250 / -9.8%
KURUNJANG: $407,500 / 4.5%
LALOR: $580,000 / 2%
LANGWARRIN: $662,500 / 4.8%
LAVERTON: $510,000 / -4.5%
LILYDALE: $708,000 / 3.6%
LOWER PLENTY: $1,277,500 / -15.3%
LYNDHURST: $581,500 / 3%
MACLEOD: $881,000 / 3.7%
MAIDSTONE: $775,000 / no change
MALVERN: $2,500,000 / 10.6%
MALVERN EAST: $2,015,000 / 6%
MANOR LAKES: $586,000 / 7.3%
MARIBYRNONG: $1,080,000 / 5.4%
MELTON SOUTH: $427,500 / 0.8%
MELTON WEST: $452,000 / -3.2%
MENTONE: $1,059,000 / 9.7%
MERNDA: $560,000 / 0.9%
MICKLEHAM: $542,500 / 3.2%
MIDDLE PARK: $1,685,500 / -4.6%
MILL PARK: $685,000 / 9.5%
MILLGROVE: $450,000 / 4.8%
MITCHAM: $949,000 / 13.7%
MONBULK: $670,000 / 0.8%
MONT ALBERT NORTH: $1,345,000 / 23.3%
MONTMORENCY: $840,000 / -2.8%
MONTROSE: $725,000 / 5.4%
MOONEE PONDS: $1,230,000 / 3.9%
MOORABBIN: $1,015,000 / 14.3%
MOOROOLBARK: $710,000 / 4.3%
MORNINGTON: $980,000 / 18.4%
MOUNT ELIZA: $1,365,000 / 7.4%
MOUNT EVELYN: $679,950 / 1.3%
MOUNT MARTHA: $1,220,000 / 12.8%
MOUNT WAVERLEY: $1,365,000 / 10.7%
MULGRAVE: $821,000 / 7.4%
MURRUMBEENA: $1,261,000 / 20.2%
NARRE WARREN: $600,000 / -1.7%
NARRE WARREN SOUTH: $650,000 / 2.2%
NEWPORT: $1,100,000 / -2.5%
NIDDRIE: $1,050,000 / 2.4%
NOBLE PARK: $647,500 / 6.5%
NORTH MELBOURNE: $1,100,000 / 11.5%
NORTH WARRANDYTE: $992,500 / 2.4%
NORTHCOTE: $1,490,000 / 11.3%
NUNAWADING: $930,000 / 5.9%
OAK PARK: $878,750 / 14.4%
OAKLEIGH: $1,050,000 / 2%
OAKLEIGH SOUTH: $900,000 / 7.1%
OFFICER: $626,000 / 3.5%
PAKENHAM: $517,000 / 3%
PARKDALE: $1,193,500 / 4.8%
PASCOE VALE: $959,500 / 5.4%
PASCOE VALE SOUTH: $1,017,500 / 4%
PEARCEDALE: $655,000 / -1.4%
POINT COOK: $645,000 / 0.8%
PORT MELBOURNE: $1,577,500 / 7%
PRAHRAN: $1,430,000 / 4.9%
PRESTON: $1,037,898 / 13%
RESERVOIR: $790,000 / 9.3%
RICHMOND: $1,361,000 / 5.8%
RINGWOOD: $902,500 / 7.4%
RINGWOOD EAST: $905,000 / 4%
RINGWOOD NORTH: $1,012,500 / 3.7%
ROSANNA: $1,200,000 / 15.1%
ROSEBUD: $535,000 / 1.2%
ROWVILLE: $841,600 / 7.8%
ROXBURGH PARK: $540,000 / 5.3%
RYE: $665,000 / 1%
SAFETY BEACH: $920,013 / 12.4%
SANDHURST: $810,000 / 12.7%
SANDRINGHAM: $1,740,000 / 2.3%
SCORESBY: $825,000 / 13.7%
SEAFORD: $690,000 / 8.5%
SEDDON: $992,500 / 4%
SKYE: $626,750 / 4.4%
SOMERVILLE: $705,000 / 3.7%
SORRENTO: $1,440,000 / -7.8%
SOUTH MELBOURNE: $1,580,000 / 18.7%
SOUTH MORANG: $633,000 / 4.6%
SOUTH YARRA: $1,600,000 / 7.7%
ST ALBANS: $587,500 / 3.1%
ST KILDA: $1,065,000 / -12.2%
STRATHMORE: $1,366,000 / 8%
SUNBURY: $517,500 / -0.9%
SUNSHINE: $782,500 / 14.1%
SUNSHINE NORTH: $647,000 / 7.1%
SUNSHINE WEST: $645,000 / 4.9%
SURREY HILLS: $1,650,000 / 2.6%
SYDENHAM: $562,400 / -3.3%
TARNEIT: $603,000 / 3.1%
TAYLORS HILL: $683,000 / -2.7%
TAYLORS LAKES: $720,000 / 5.3%
TEMPLESTOWE: $1,430,000 / 8.9%
TEMPLESTOWE LOWER: $1,090,000 / 9.9%
THE BASIN: $827,500 / 3.7%
THOMASTOWN: $577,000 / 3.3%
THORNBURY: $1,145,000 / 9.4%
TOORAK: $3,600,000 / 7.7%
TRUGANINA: $570,000 / 2.9%
UPWEY: $718,000 / 3.5%
VERMONT: $1,211,000 / 15.4%
VERMONT SOUTH: $1,150,000 / 8.9%
VIEWBANK: $915,000 / 10.5%
WANTIRNA: $840,000 / 8.7%
WANTIRNA SOUTH: $1,070,000 / 9.3%
WARRANDYTE: $1,156,000 / -10.8%
WARRANWOOD: $874,000 / -0.8%
WATSONIA: $772,750 / 8.3%
WATTLE GLEN: $1,020,000 / 4.8%
WERRIBEE: $491,000 / 2.9%
WEST FOOTSCRAY: $800,000 / -2.3%
WHEELERS HILL: $1,320,000 / 10.6%
WHITTLESEA: $595,000 / -4.2%
WILLIAMS LANDING: $832,500 / 1.2%
WILLIAMSTOWN: $1,450,000 / 10%
WINDSOR: $1,260,000 / 13.7%
WOLLERT: $552,000 / -2.6%
WYNDHAM VALE: $463,000 / -2.7%
YARRA JUNCTION: $600,000 / 1.3%
YARRAVILLE: $1,065,000 / 1.5%
Units
ABBOTSFORD: $608,000 / 4.5%
AIRPORT WEST: $629,000 / 1.8%
ARMADALE: $483,750 / 16.1%
ASCOT VALE: $670,000 / 26.2%
ASHWOOD: $833,000 / 1.8%
BALACLAVA: $518,750 / -5.7%
BALWYN: $600,000 / 18.4%
BALWYN NORTH: $1,060,000 / 29.3%
BAYSWATER: $590,000 / 10.9%
BEAUMARIS: $885,000 / 1.5%
BENTLEIGH: $735,500 / 4.6%
BENTLEIGH EAST: $1,005,000 / 8.1%
BLACK ROCK: $755,000 / -8.3%
BLACKBURN: $820,500 / -0.1%
BLACKBURN NORTH: $740,000 / 13.6%
BONBEACH: $677,725 / 12.4%
BORONIA: $592,500 / 7.3%
BOX HILL: $600,125 / 25.3%
BOX HILL NORTH: $732,000 / 16.7%
BOX HILL SOUTH: $752,500 / 5.2%
BRAYBROOK: $643,000 / 7.2%
BRIGHTON: $1,172,500 / -0.4%
BRUNSWICK: $550,000 / 10.5%
BRUNSWICK EAST: $432,500 / no change
BRUNSWICK WEST: $420,000 / -1.5%
BULLEEN: $850,000 / -5.1%
BUNDOORA: $480,000 / 5.3%
BURWOOD: $790,000 / 10.4%
CAMBERWELL: $1,005,750 / 11.4%
CARLTON: $425,000 / -6.1%
CARNEGIE: $637,500 / 25.5%
CARRUM: $745,000 / 5.9%
CARRUM DOWNS: $450,000 / 12.5%
CAULFIELD: $775,000 / -6.4%
CAULFIELD NORTH: $670,000 / -11.8%
CAULFIELD SOUTH: $750,000 / 14.9%
CHADSTONE: $866,000 / 16.3%
CHELSEA: $640,000 / 5.8%
CHELTENHAM: $630,000 / 10.5%
CLARINDA: $750,000 / 8.3%
CLAYTON: $718,000 / 9.7%
CLAYTON SOUTH: $640,250 / 4.8%
CLIFTON HILL: $717,500 / -2.6%
COBURG: $630,500 / 3.8%
COBURG NORTH: $640,000 / 3.3%
COLLINGWOOD: $605,000 / -1.7%
CRAIGIEBURN: $355,000 / -2.8%
CROYDON: $591,000 / 7.3%
DANDENONG: $375,000 / 1.4%
DOCKLANDS: $617,000 / 0.5%
DONCASTER: $626,000 / 4.5%
DONCASTER EAST: $932,500 / 15.8%
DONVALE: $767,250 / 6.7%
EAST MELBOURNE: $1,046,500 / -5.2%
ELSTERNWICK: $610,000 / 7.6%
ELTHAM: $686,000 / 11.2%
ELWOOD: $630,000 / 9.7%
ESSENDON: $602,500 / 21.7%
ESSENDON NORTH: $563,750 / 1.5%
FAIRFIELD: $620,000 / 33.1%
FAWKNER: $500,000 / 7.6%
FERNTREE GULLY: $577,500 / 9.3%
FITZROY: $800,000 / 8.1%
FITZROY NORTH: $717,500 / 21.5%
FLEMINGTON: $491,250 / 12.5%
FOOTSCRAY: $410,000 / 6.7%
FOREST HILL: $722,000 / 8.2%
FRANKSTON: $383,000 / 1.2%
FRANKSTON SOUTH: $609,500 / -2.5%
GLEN HUNTLY: $635,750 / 1.4%
GLEN IRIS: $675,500 / 6.2%
GLEN WAVERLEY: $830,000 / 6.7%
GLENROY: $560,000 / 6.4%
GREENSBOROUGH: $647,500 / 9.8%
HADFIELD: $530,000 / 1.2%
HAMPTON: $837,500 / 18.4%
HAMPTON EAST: $684,000 / -1.7%
HAWTHORN: $677,000 / 7.7%
HAWTHORN EAST: $937,500 / 7.3%
HEIDELBERG: $646,000 / -2.2%
HEIDELBERG HEIGHTS: $680,000 / 12.9%
HIGHETT: $795,000 / 7.3%
HUGHESDALE: $450,000 / 20.2%
IVANHOE: $755,000 / -0.4%
KENSINGTON: $645,000 / 0.2%
KEW: $741,500 / 12.6%
KILSYTH: $580,000 / 10.8%
KNOXFIELD: $627,750 / 1.4%
LALOR: $483,351 / 13.9%
LANGWARRIN: $459,000 / 0.3%
LILYDALE: $507,500 / 6.1%
MACLEOD: $664,000 / 13.9%
MAIDSTONE: $645,000 / 12.9%
MALVERN: $750,000 / 16.6%
MALVERN EAST: $683,750 / -1.2%
MARIBYRNONG: $545,000 / 2.4%
MELBOURNE: $500,000 / 10.2%
MENTONE: $730,250 / 5.6%
MITCHAM: $660,500 / 13.9%
MONTMORENCY: $610,000 / 11.8%
MOONEE PONDS: $510,000 / 10.8%
MOOROOLBARK: $587,000 / 5.9%
MORDIALLOC: $745,750 / 6.1%
MORNINGTON: $583,500 / 6.6%
MOUNT WAVERLEY: $926,000 / 14.8%
MULGRAVE: $722,500 / 5.5%
MURRUMBEENA: $598,550 / 10.1%
NEWPORT: $775,000 / 9.8%
NIDDRIE: $750,000 / 1.4%
NOBLE PARK: $435,000 / 5.6%
NORTH MELBOURNE: $720,000 / 5.5%
NORTHCOTE: $595,000 / 0.4%
NUNAWADING: $650,000 / 11%
OAK PARK: $729,675 / -4.4%
OAKLEIGH SOUTH: $800,000 / 17.6%
ORMOND: $607,400 / 14.3%
PAKENHAM: $416,000 / 5.7%
PARKDALE: $773,750 / 13.4%
PASCOE VALE: $625,000 / -0.4%
POINT COOK: $410,000 / 3.7%
PORT MELBOURNE: $712,500 / -2.3%
PRAHRAN: $462,500 / 4.4%
PRESTON: $565,000 / 16.5%
RESERVOIR: $568,500 / 7.4%
RICHMOND: $525,000 / -2.1%
RINGWOOD: $572,750 / -0.1%
RINGWOOD EAST: $595,000 / 11.9%
SANDRINGHAM: $1,100,000 / -3.9%
SEAFORD: $575,000 / 6.3%
SOUTH MELBOURNE: $608,900 / 1.2%
SOUTH YARRA: $595,000 / 9.6%
SOUTHBANK: $545,000 / 7.4%
ST ALBANS: $490,000 / 4.5%
ST KILDA: $519,500 / 6.2%
ST KILDA EAST: $590,500 / 1.7%
ST KILDA WEST: $600,000 / 15.7%
STRATHMORE: $780,000 / 8.6%
SURREY HILLS: $767,500 / 9.2%
TEMPLESTOWE LOWER: $762,500 / 8.2%
THOMASTOWN: $480,000 / -0.8%
THORNBURY: $515,000 / 1.2%
TOORAK: $951,000 / -4.9%
VERMONT: $859,000 / 13.5%
WERRIBEE: $360,000 / -7.9%
WEST FOOTSCRAY: $410,500 / 12.6%
WEST MELBOURNE: $707,000 / 33.9%
WILLIAMSTOWN: $592,500 / 14.6%
WINDSOR: $619,000 / 8.1%
YARRAVILLE: $643,500 / 6.6%
Source: Real Estate Institute of Victoria, data to June 30
The post Melbourne spring property market awaiting eased restrictions to bloom appeared first on realestate.com.au.