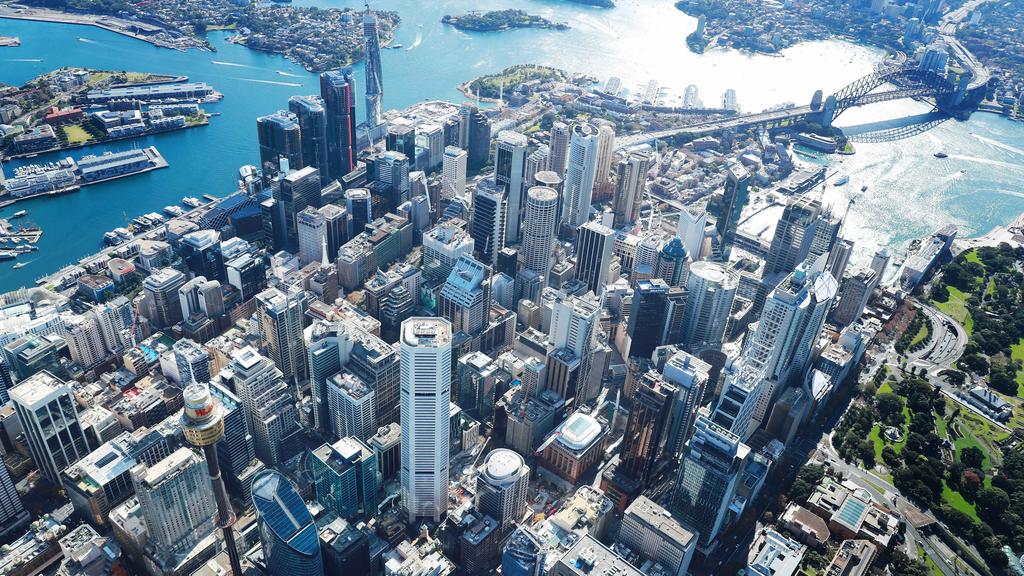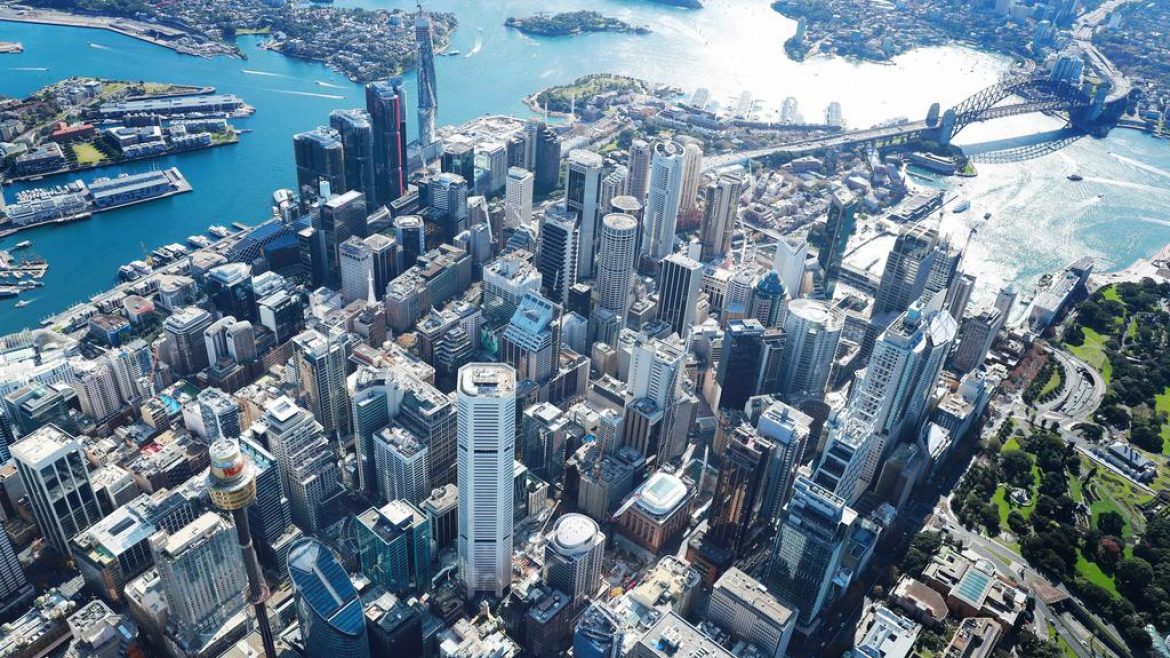
CBD apartments are among the weaker Sydney markets. Picture: John Feder
Falls in Sydney home prices have been slowing over the past month but the market will be on a knife edge this spring as government and banks scale back support for struggling households.
The median home price inched down 0.5 per cent over August, nearly half the rate of decline recorded over July, according to CoreLogic’s hedonic home value index published Tuesday.
The median price of a Sydney home is now about $860,000 – 2.6 per cent lower than it was four months ago but 9.8 per cent higher than a year ago.
MORE: Home prices defying COVID-19 fears
BridgeClimb engineer scores $10m-plus sale
CoreLogic noted there was wide variance in price movements across city regions.
Higher end markets such as the Sutherland Shire and northern beaches, along with Parramatta and Ryde, recorded the biggest declines in values.
Prices in much of the Greater Western Sydney area were more resilient, with values in the southwest, Blacktown and Hills region recording only minor falls.
The biggest fall was observed in the northern beaches, with a 1.5 per cent average drop over August, while the best performing market was the Central Coast with a 0.3 per cent rise.
CoreLogic analyst Eliza Owen said the falls in pricier regions were typical of the start of housing downturns.
Prices tended to fall in more expensive markets first and the weakness then “rippled out” to cheaper suburbs, she said.
“The Central Coast is probably lagging Sydney, while in the more expensive areas there may be more willingness for vendors to adjust their expectations,” Ms Owen said. “More expensive areas are also more volatile because they had larger price rises before the pandemic.”

CoreLogic’s Eliza Owen said vendors may be adjusting their price expectations.
Ms Owen described the market as “stable” but with high “downside risk” because of the potential for another outbreak and further job losses, which would thin the pool of buyers.
She pointed to Melbourne as an example of what would happen to Sydney if there was another outbreak. Melbourne median price dropped 1.2 per cent for the month and 5.6 per cent over the past four months – which Ms Owen said was “significant”.
Prices were largely unchanged in Brisbane, Adelaide and Perth.
CoreLogic’s head of research Tim Lawless said Sydney price falls were lower than last month due to buoyant buyer activity and fewer homeowners listing their properties, which meant sellers didn’t need to make major price cuts to get their homes sold.
Bank support for homeowners such as mortgage deferral periods also prevented a widespread rise in distressed sales that would otherwise drag down prices.

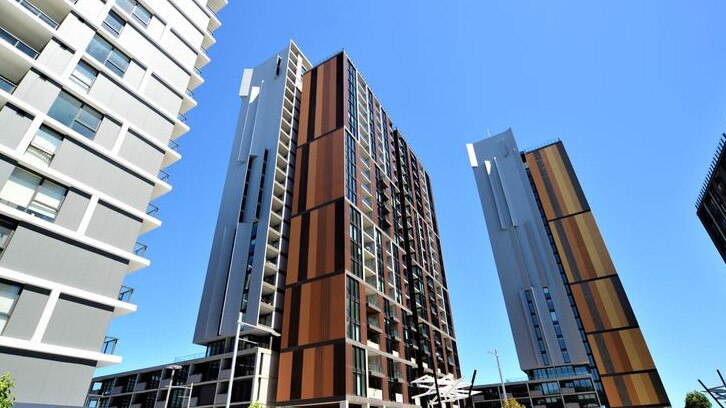
Buyers are more likely to get discounts in areas with lots of high density units.
“This could potentially change as fiscal support starts to taper at the end of September and distressed borrowers taking a repayment holiday reach their six month check-in period,” Mr Lawless said.
“The timing of these two events could be the catalyst for a gradual rise in distressed listings … it could signal that vendors will need to offer up greater discounts.”
My Housing Market economist Andrew Wilson said the region most in danger of mass distressed sales was the CBD and its surrounds.
Landlords in the area were struggling to tenant their properties due to travel restrictions, which kept away international students and travellers who normally rented their homes out, he said.
Realestate.com.au chief economist Nerida Conisbee said the market was more uneven than normal. “You might get a bargain on a CBD unit, but not a luxury Bronte house – differences in the market have become more extreme.”
HOME PRICE MOVEMENTS IN SYDNEY REGIONS
(by three-month change)
Central Coast 0.5%
Hills region -1.6%
Blacktown -0.9%
City and inner south -1.4%
Eastern suburbs -1.0%
Inner southwest -2.6%
Inner west -2.9%
North shore -2.8%
Northern beaches -3.8%
Outer southwest -0.6%
Outer west and Blue Mountains -1.0%
Parramatta -2.6%
Ryde -2.5%
Southwest -1.9%
Sutherland Shire -3.9%
Greater Sydney -2.1%
Source: CoreLogic, includes data for houses and units
The post Sydney housing market ‘uneven’ as price changes vary across regions appeared first on realestate.com.au.

